Beyond the kick: Unlocking penaltity prediction through learning
In the first part, we explored the intricate relationship between various parameters and the direction of penalties taken by Harry Kane. Building on that foundation, we now seek to expand our analysis further by teaching a model to understand the complex relationships within our dataset.
Simplifying the Problem Link to heading

To focus on meaningful insights, we decided to simplify the problem from a five-class classification problem to a three-class one. This reduction allowed us to capture the critical features while keeping the complexity level lower for this first iteration of model development.
Data Reduction Link to heading
Our dataset initially comprised 36 parameters across 89 rows. Given the limited number of samples, we faced the curse of dimensionality. To mitigate this, we employed feature engineering and domain expertise to combine certain parameters, derive new features, and trim unnecessary ones. By the end of this process, we reduced the dataset to 21 columns.
Choosing the Model Link to heading

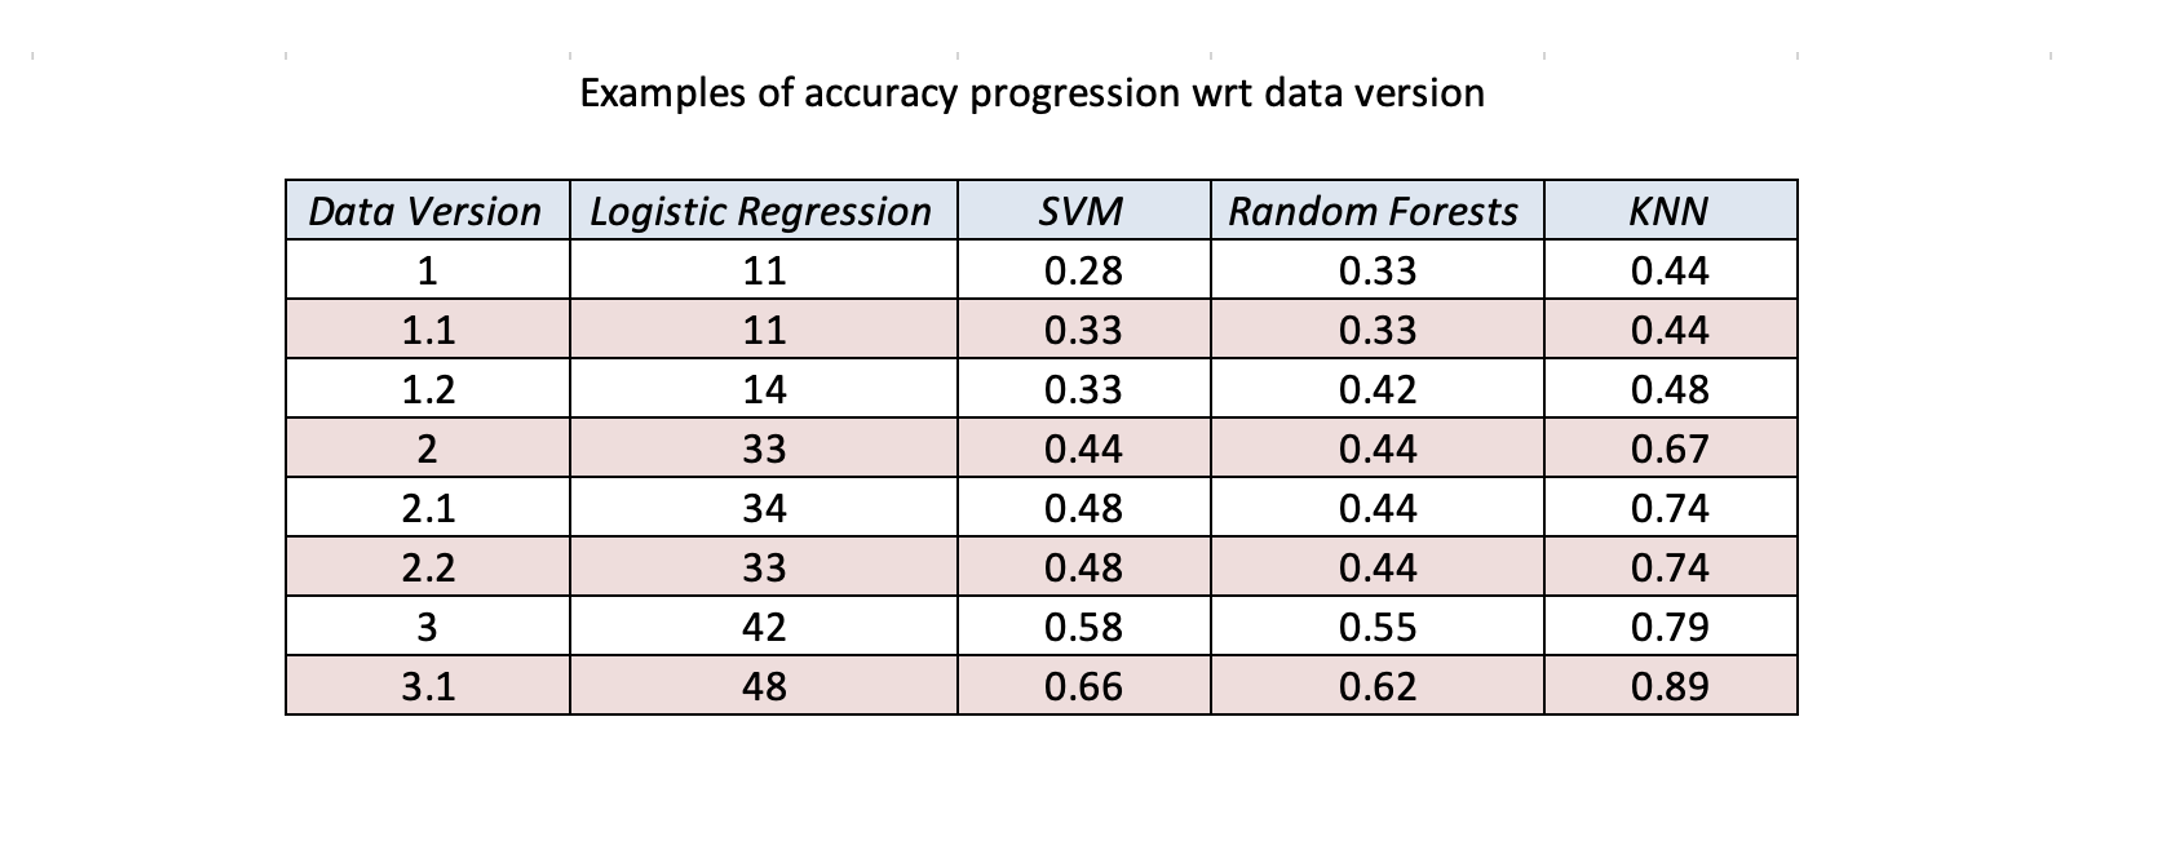
Throughout the process of dimensionality reduction, I experimented with various machine learning models, assessing how well each one performed on our evolving dataset. Distance-based models outperformed gradient-based models almost every time. This finding led me to focus more on KNN as my primary model.
Data Bias and Class Imbalance Link to heading

During the initial stages, one significant issue we faced was class imbalance. Without addressing this, our model was skewing predictions towards the most frequent class (Class 1) as visualized in the confusion matrix above. This class bias negatively impacted accuracy, as the model failed to generalize across other classes.
To address this, we applied SMOTE to balance the classes, and the model’s predictions became more evenly distributed across all classes, leading to a noticeable improvement in accuracy.
Understanding Model Accuracy Link to heading
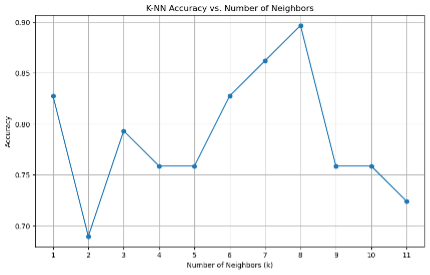
In our modeling efforts, we achieved an accuracy of 89% with the KNN algorithm using eight nearest neighbors. However, we chose the model with seven neighbors, which had an accuracy of 86%, for its better generalization.

KNN, being a non-parametric approach, means it does not assume any specific distribution for the underlying data. It seeks to fit new inferences to the available data based on distance metrics. However, it’s important to recognize that penalty kicks remain fundamentally random events, influenced by psychological factors, game state, player decisions, among many others. While we can model relationships based on historical data, there will always be a degree of uncertainty that models cannot predict with certainty.
To fully understand how the model performs under different scenarios, I created a dataset containing 5,598,720 possible scenarios the model could encounter. You can generate the dataset on your own and use the pretrained models for predicting the direction of Harry Kane’s shot from here. This comprehensive dataset allows us to see how the model generalizes to different hypothetical situations, even though penalties are inherently unpredictable.
What’s Next? Link to heading
As we continue refining the dataset and the model, we’ll delve deeper into some of the more nuanced findings, exploring psychological factors, game pressure, and other external elements that may influence penalty-taking behavior.